

Keep the browser tab visible while monitoring—live screens pause automatic refreshes when the tab is in the background. Everyone in your organization sees the same figures, including revenue.
Check experience status at a glance
Open your experience from Experiences to see its live status right in the header:- Status chip: Draft, Scheduled, Live, Ended, or Ended early. See Experiences.
- Sequences: Total count broken down by status (for example,
2 (1 Live | 1 Scheduled)). - Opens and Closes: Shown in the experience’s time zone.
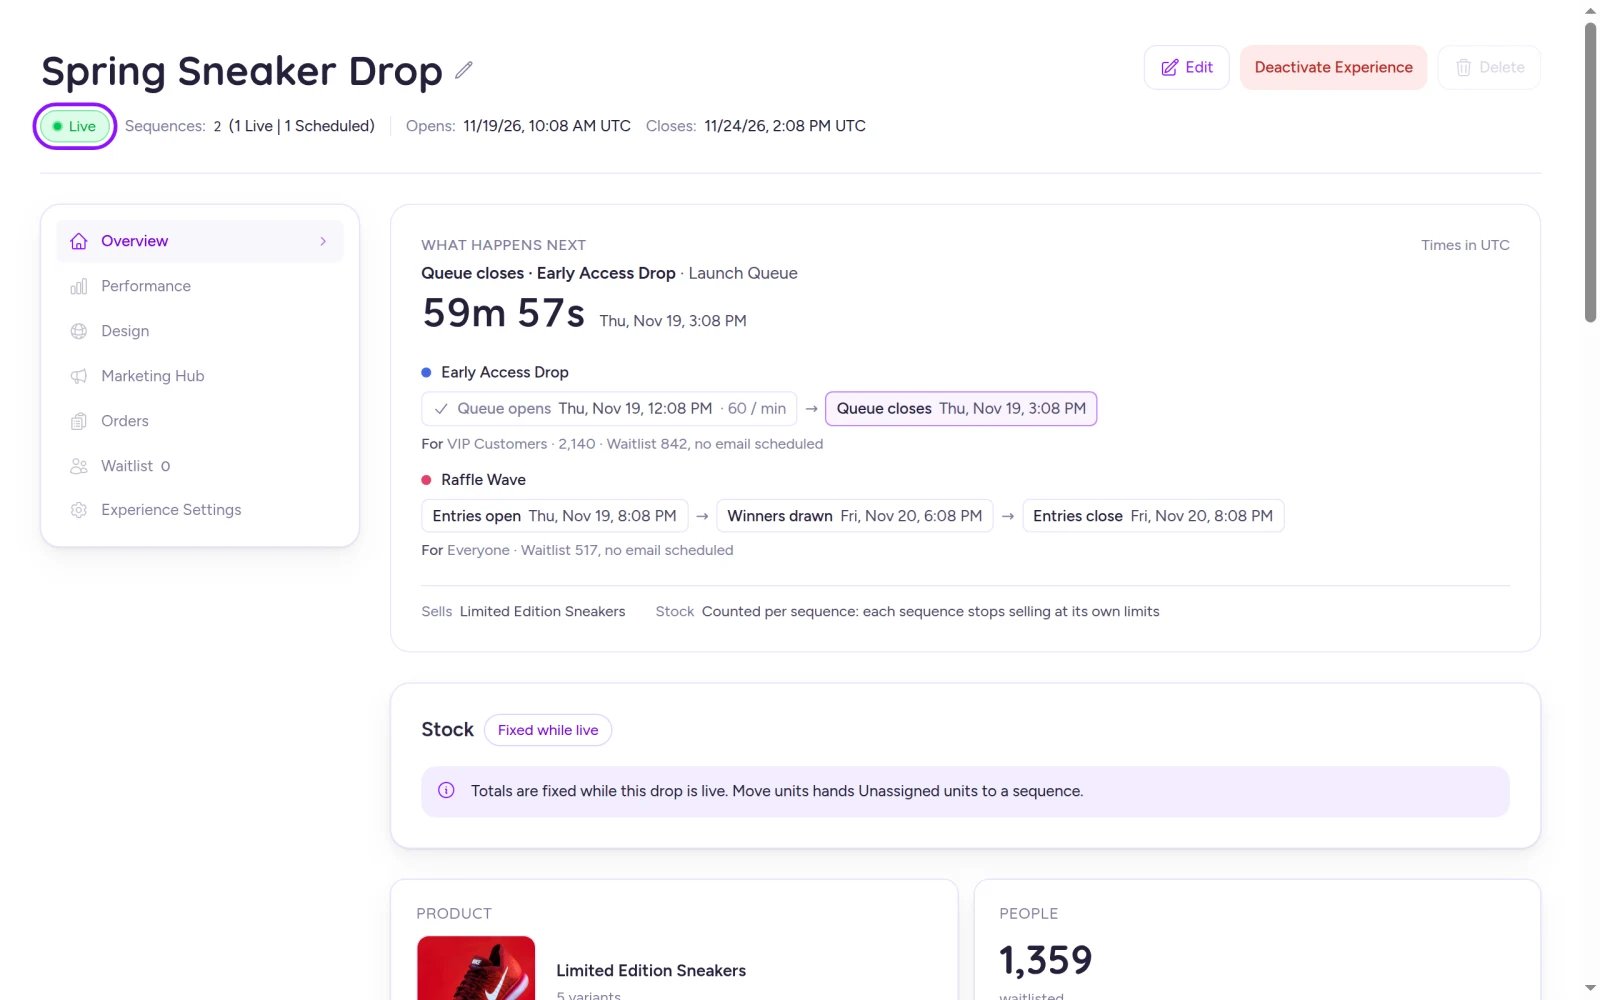
The experience header and What happens next card give you an instant status check without opening Performance.
Monitor sequences and stock on Overview
The Sequences card
Further down the experience Overview, the Sequences card displays live status tiles for every active sequence:
Underneath the tiles, each card summarizes waitlist size, scheduled announcements, and the next distribution to open.
The sequence Overview
Select View on any sequence to drill into its Overview:- Distributions card: Highlights the live distribution at the top with its live tiles, followed by compact rows for upcoming or ended distributions.
- Stock card: Tracks Allocated, Sold, In checkout, Remaining, and Status for every size (plus Unassigned units when available), updating about every 5 seconds. See Stock.
- Auction and appointment views: Live auctions and appointments render dedicated control panels below the Distributions card. See Monitor a live auction and Monitor live appointments.
The summary Performance card pinned above the tabs on a sequence page reflects the date range selected on Home and doesn’t auto-refresh—reload the page to update it.
Open the Performance view
Open Performance from any of these spots:- Performance in the experience’s left navigation.
- Performance in a sequence’s navigation, or View performance on its summary card.
- View performance from a sequence card’s menu, or Open performance on a live card in the experience overview.
The experience overview (multi-sequence drops)
When an experience has multiple sequences, the overview labels each sequence as a “drop” (By drop, Next drop). While any distribution is active, Launch so far adds a Live now tile, and up to four live cards appear below it (active distributions first, followed by settling ones). Each card shows when its data was last updated and its refresh interval.
For By drop tables, insight cards, and post-drop metrics, see Read your results.
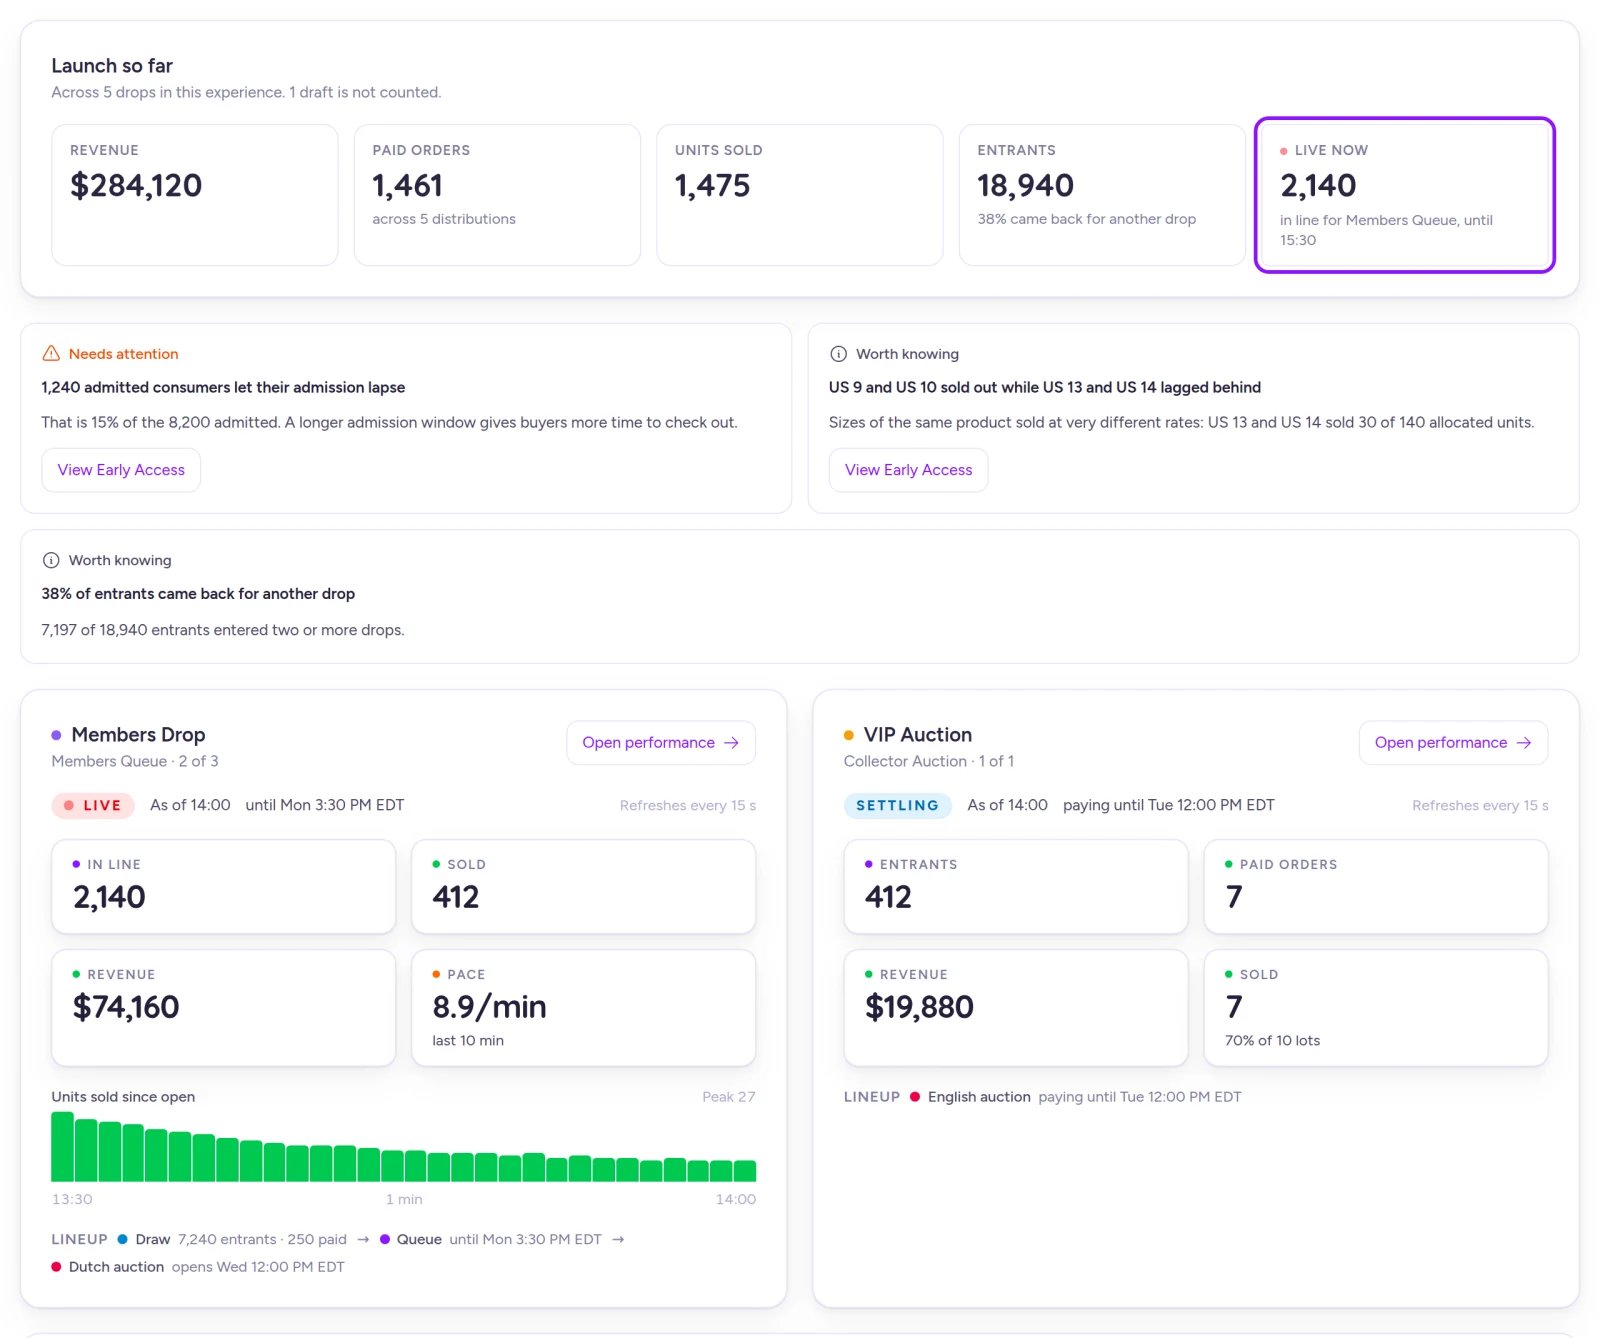
Live now sums current people in line for queues with cumulative entrants for every other distribution type.
The sequence live screen
When a sequence has multiple distributions, a switcher at the top lets you choose a specific distribution or Whole sequence for combined totals (it opens on the most recently opened live distribution, and the selection stays in the URL so you can share the link). Use the Watch / Run toggle at the top to switch between live monitoring and quick access to settings (the toggle isn’t kept in the URL and resets to Watch on reload).Watch mode
Watch is the default monitoring screen for a live distribution. At the top, Right now tracks live headline counts since opening:
Below Right now, three live panels track momentum and inventory:
- Pace since open: Interval charts plotting entries and units sold since doors opened.
- Play by play: A newest-first feed of notable drop events—sizes selling out, setting changes, and announcements sent.
- Sizes: A tile per size (grouped by product when selling multiple items) that progresses from Selling to Last call (at 80% sold) to Gone.
Allocation progress (
of N allocated), size meters, Last call / Gone badges, and size sold-out events in Play by play only appear when a sequence has a single distribution. In multi-distribution sequences, Sizes shows units sold only.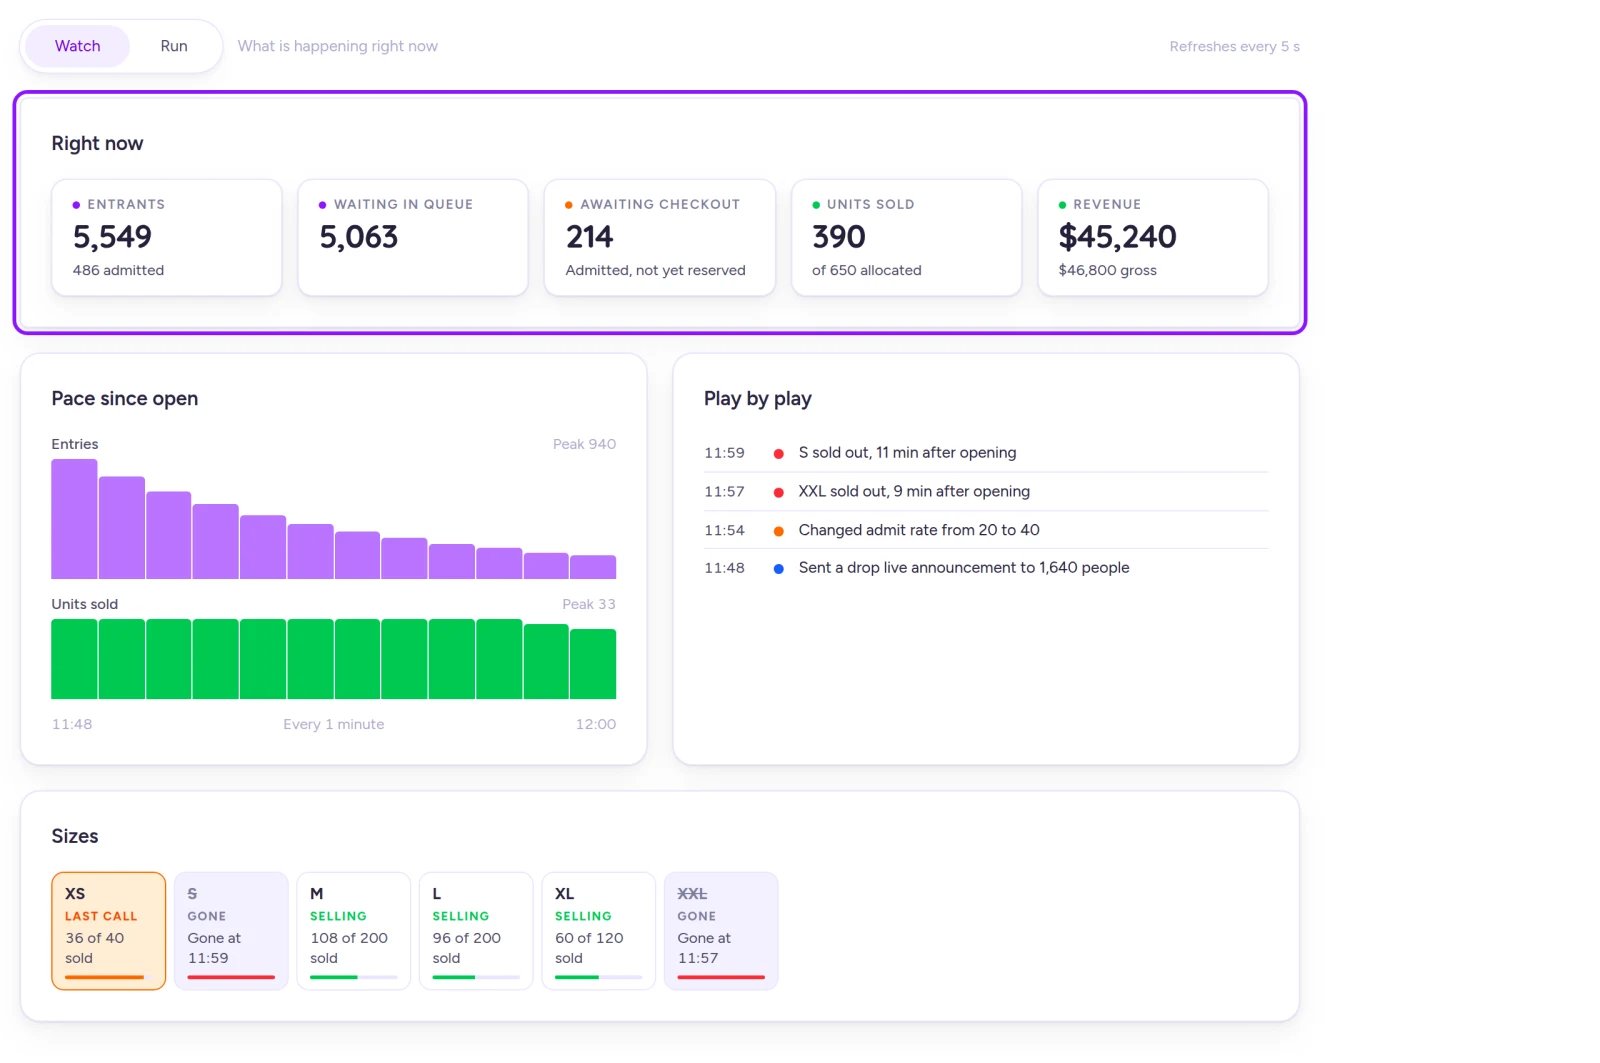
Watch mode tracks live queue depth, sales pace, notable events, and size sell-through.
Run mode
Switch to Run for a funnel view and quick links to live controls:- Flow through the drop: Shows how customers are moving from In queue (with total entrants) to Awaiting checkout (with total admitted) to Paid orders (with units sold).
- Change a setting: Shortcut links for live queues (Admit rate, Admission window) and live draws (Admission window, Capacity). Selecting any link opens the distribution’s settings editor on the sequence’s Overview without changing anything until you save. See Change things mid-drop.
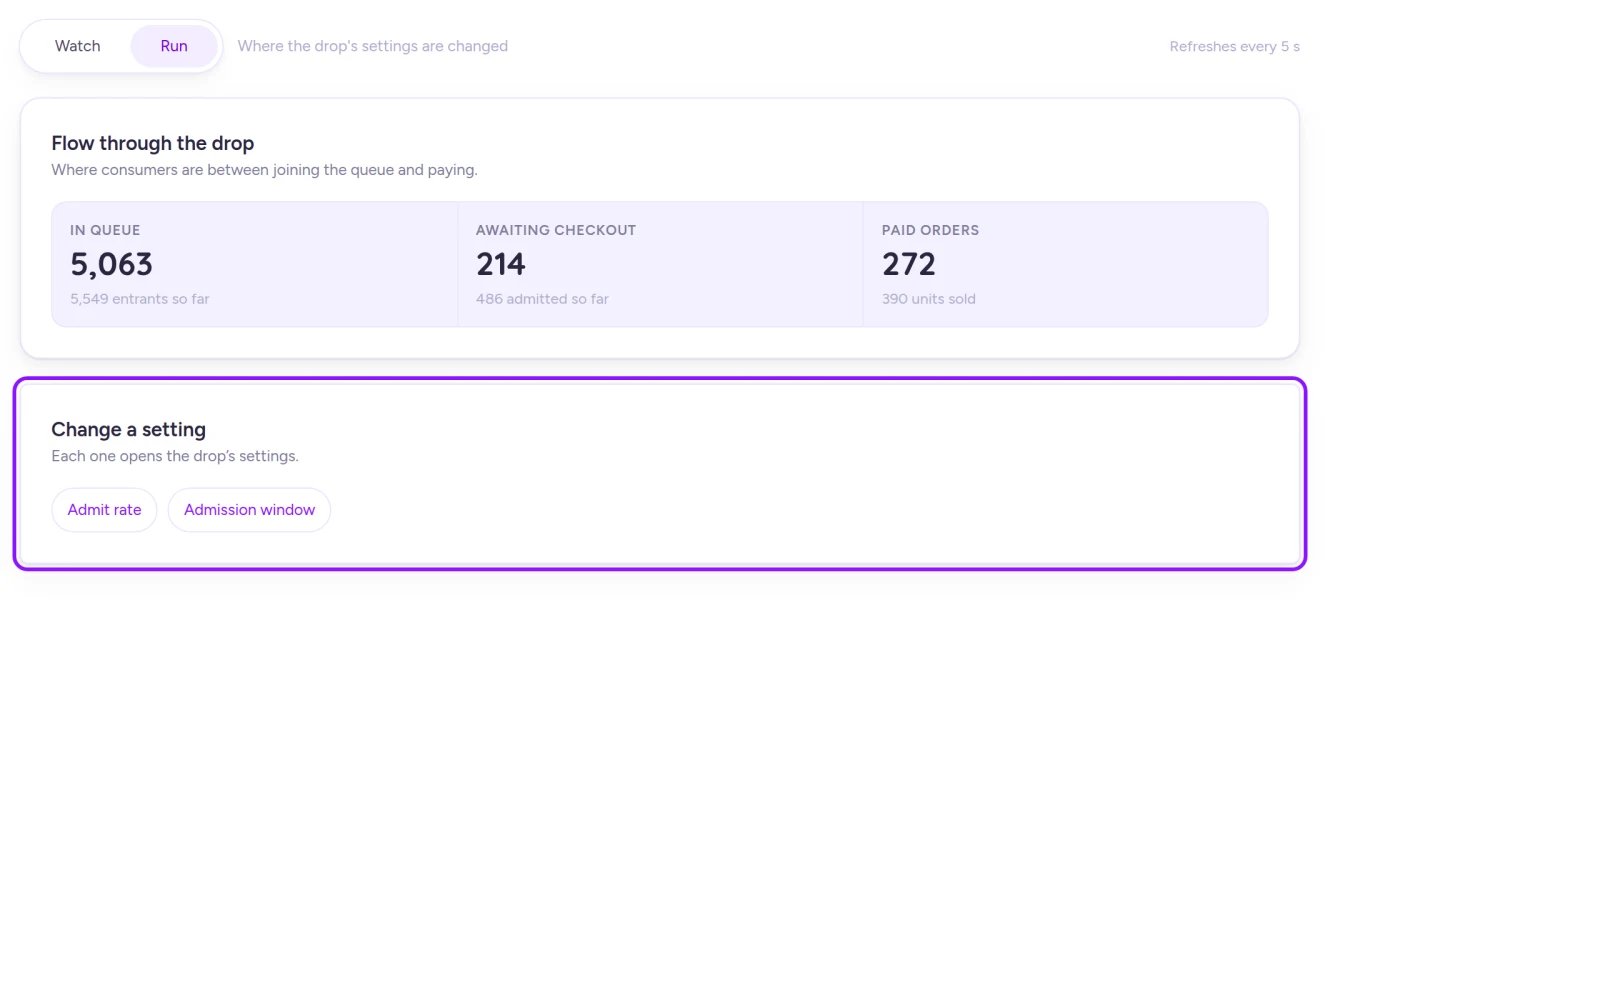
Run mode shows funnel flow and shortcuts straight to the distribution's settings editor.
How fresh the numbers are
- Live screens and the experience overview refresh roughly every 5 seconds while the browser tab is active, and pause when the tab is hidden.
- Individual figures can occasionally lag by up to 2 minutes during recalculations.
- Entrants inside Launch so far can lag by up to 1 minute (use the individual live cards for 5-second updates).
- The summary Performance card on a sequence page doesn’t auto-refresh.
When Live starts and stops
- Queue waiting room (5 minutes before open): Customers can join a queue’s waiting room 5 minutes before Opens, though no one is admitted until Opens. During those 5 minutes, the queue’s Performance screen already shows Live, while the experience and sequence chips stay Scheduled (unless another distribution is already live).
- Queue clearing after close: A queue stays Live past its Closes time while people are still waiting in line, though no one waiting is admitted after close. While clearing, the close time is hidden and the switcher reads Live now.
- Settling: After entry closes, a distribution moves to Settling while admitted customers or winners still have time to pay (or while a draw settles results). Figures can continue changing during this window and refresh every 30 seconds (or every 5 seconds if another distribution in the sequence is still live). For final post-drop reporting, see Read your results.
Monitor a live auction
On the sequence’s Overview, each auction gets a dedicated English auction or Dutch auction panel below the Distributions card, complete with a phase badge (Upcoming, Bidding, Settling, Settled, Ended, or Ended early) and a live status headline (for example,"Bidding is open — [name] leads at [amount] across [count] bids.").
Below the cards, an event stream logs live bids and milestones such as anti-snipe extensions, reserve met, and price drops.
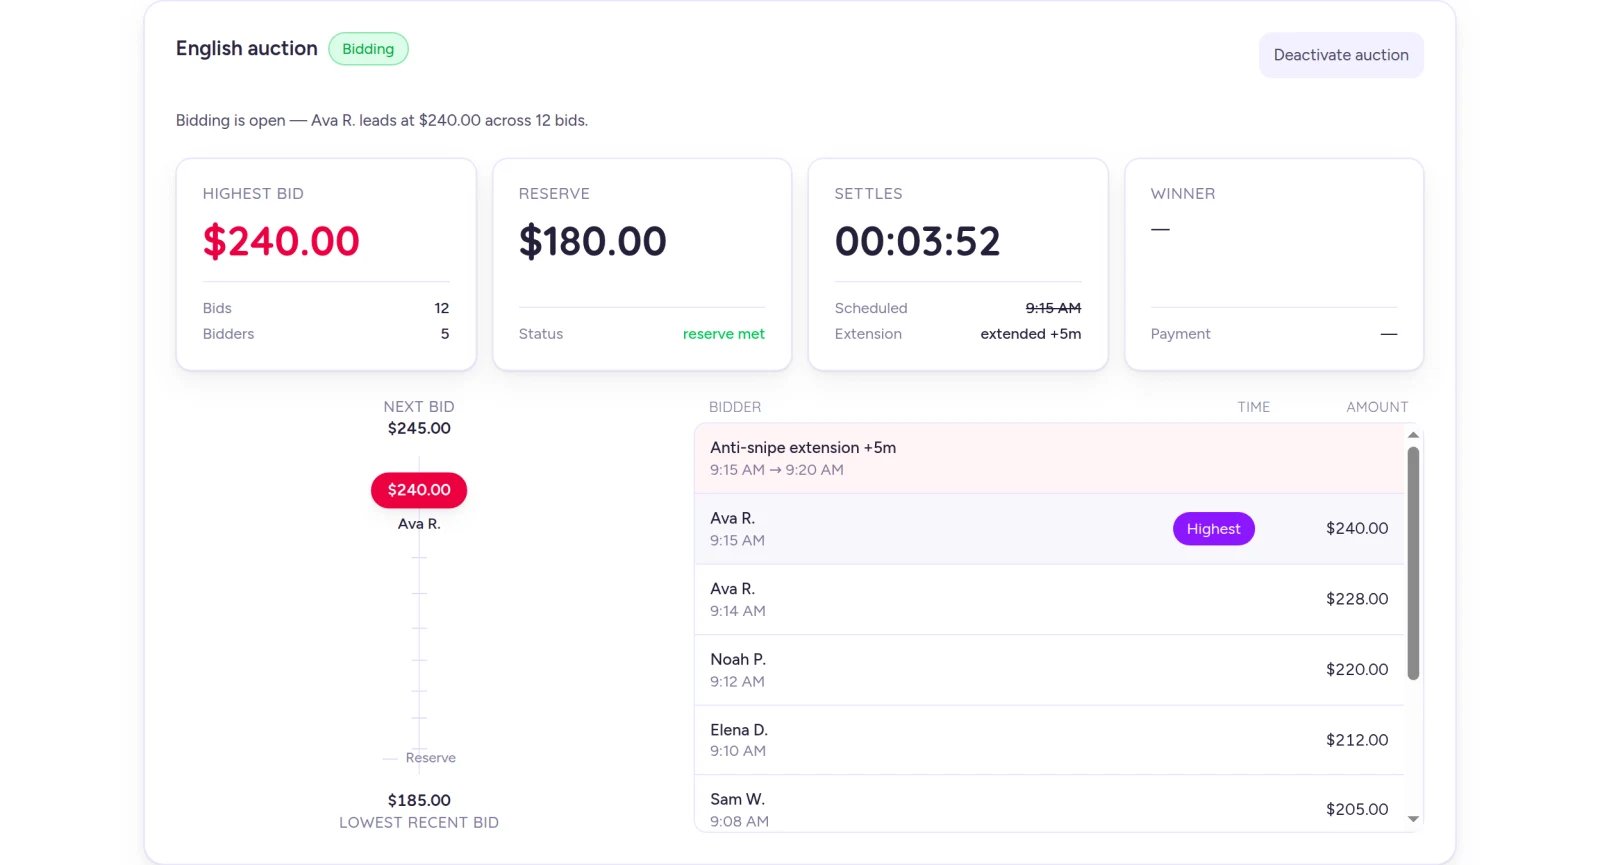
The live English auction view tracks the leading bid, reserve status, settlement countdown, and bid stream.
Monitor live appointments
When a sequence runs an appointment distribution, a dedicated panel appears below the Distributions card showing the appointment name, location, a day strip with booking counts against capacity, and the time slots for the selected day (days outside the window readnot in window; closed days read closed).
Select any time slot to inspect Slot Attendees and their status (Confirmed, Checked In, Cancelled, or Completed). All slot times appear in the appointment’s time zone, though the view doesn’t name the time zone. To cancel a booking, see Change things mid-drop.
On Shopify
The Performance views and live screens work the same way inside the Fanfare app in Shopify, except appointments aren’t offered so there’s no appointment view.Related
Change things mid-drop
Pause a queue, adjust settings, move units, or cancel a booking.
Read your results
Understand Home metrics, By drop breakdowns, and final post-drop results.
Before doors open
Pre-launch checklist, automatic locks, and demand forecasts.
Stop a drop
Deactivate or delete a distribution, sequence, or experience.
Troubleshooting a live drop
Quick fixes when something looks wrong mid-drop.