

A sequence is one way into an experience (see Sequences and routing). On the Performance tabs, Fanfare refers to each sequence as a drop (as in By drop and All drops). Results appear once at least one sequence has a distribution.
Where to find your results
Every distribution on the Performance tabs shows a phase: Upcoming, Live, Settling, or Closed (sequences without a distribution show Draft). Settling means entry has closed, but final numbers can still move—a draw hasn’t been picked yet, an auction hasn’t closed, or admitted customers are still inside their payment window. These phases are separate from the status badges on your experiences list; see Experiences.
Read the Home metrics panel
1
Pick a rolling time window
Open Home and select Last 24 hours, 7 days, 30 days, or 90 days. Fanfare remembers your choice in this browser. Periods are rolling—7 days means the last 7 × 24 hours, not the current calendar week.
2
Review the five headline cards
Check Views, Entries, Wins, Paid orders, and Net revenue. Each card includes a breakdown underneath:
- Views breaks down by customer segment (Champions, Loyal, At-Risk, New, Lost), showing up to five segments (so rows may not sum to the total).
- Entries and Wins break down by distribution type.
- Paid orders and Net revenue break down by your top four experiences plus Other. Net revenue also displays gross revenue underneath.
3
Explore the trend chart
Below the cards, switch the chart between Views, Entries (default), Wins, and Paid orders to spot spikes over time. (Net revenue doesn’t have a chart.)
Read an experience’s Performance tab
What appears on an experience’s Performance tab depends on its sequences:- No sequences: Shows “No drops yet” until you add a drop.
- One sequence: Opens that sequence’s own Performance view directly (see Read a sequence’s Performance tab).
- Two or more sequences (all drafts): Shows “Nothing to measure yet” with links to each draft until a distribution is added.
- Two or more sequences (at least one with a distribution): Opens the experience overview below. Any draft sequences appear below the table and aren’t included in totals.
Launch so far
The headline tiles summarize every sequence in the experience since launch:
While a distribution is active, Live now and live monitoring cards replace Next drop. See Watch a live drop.
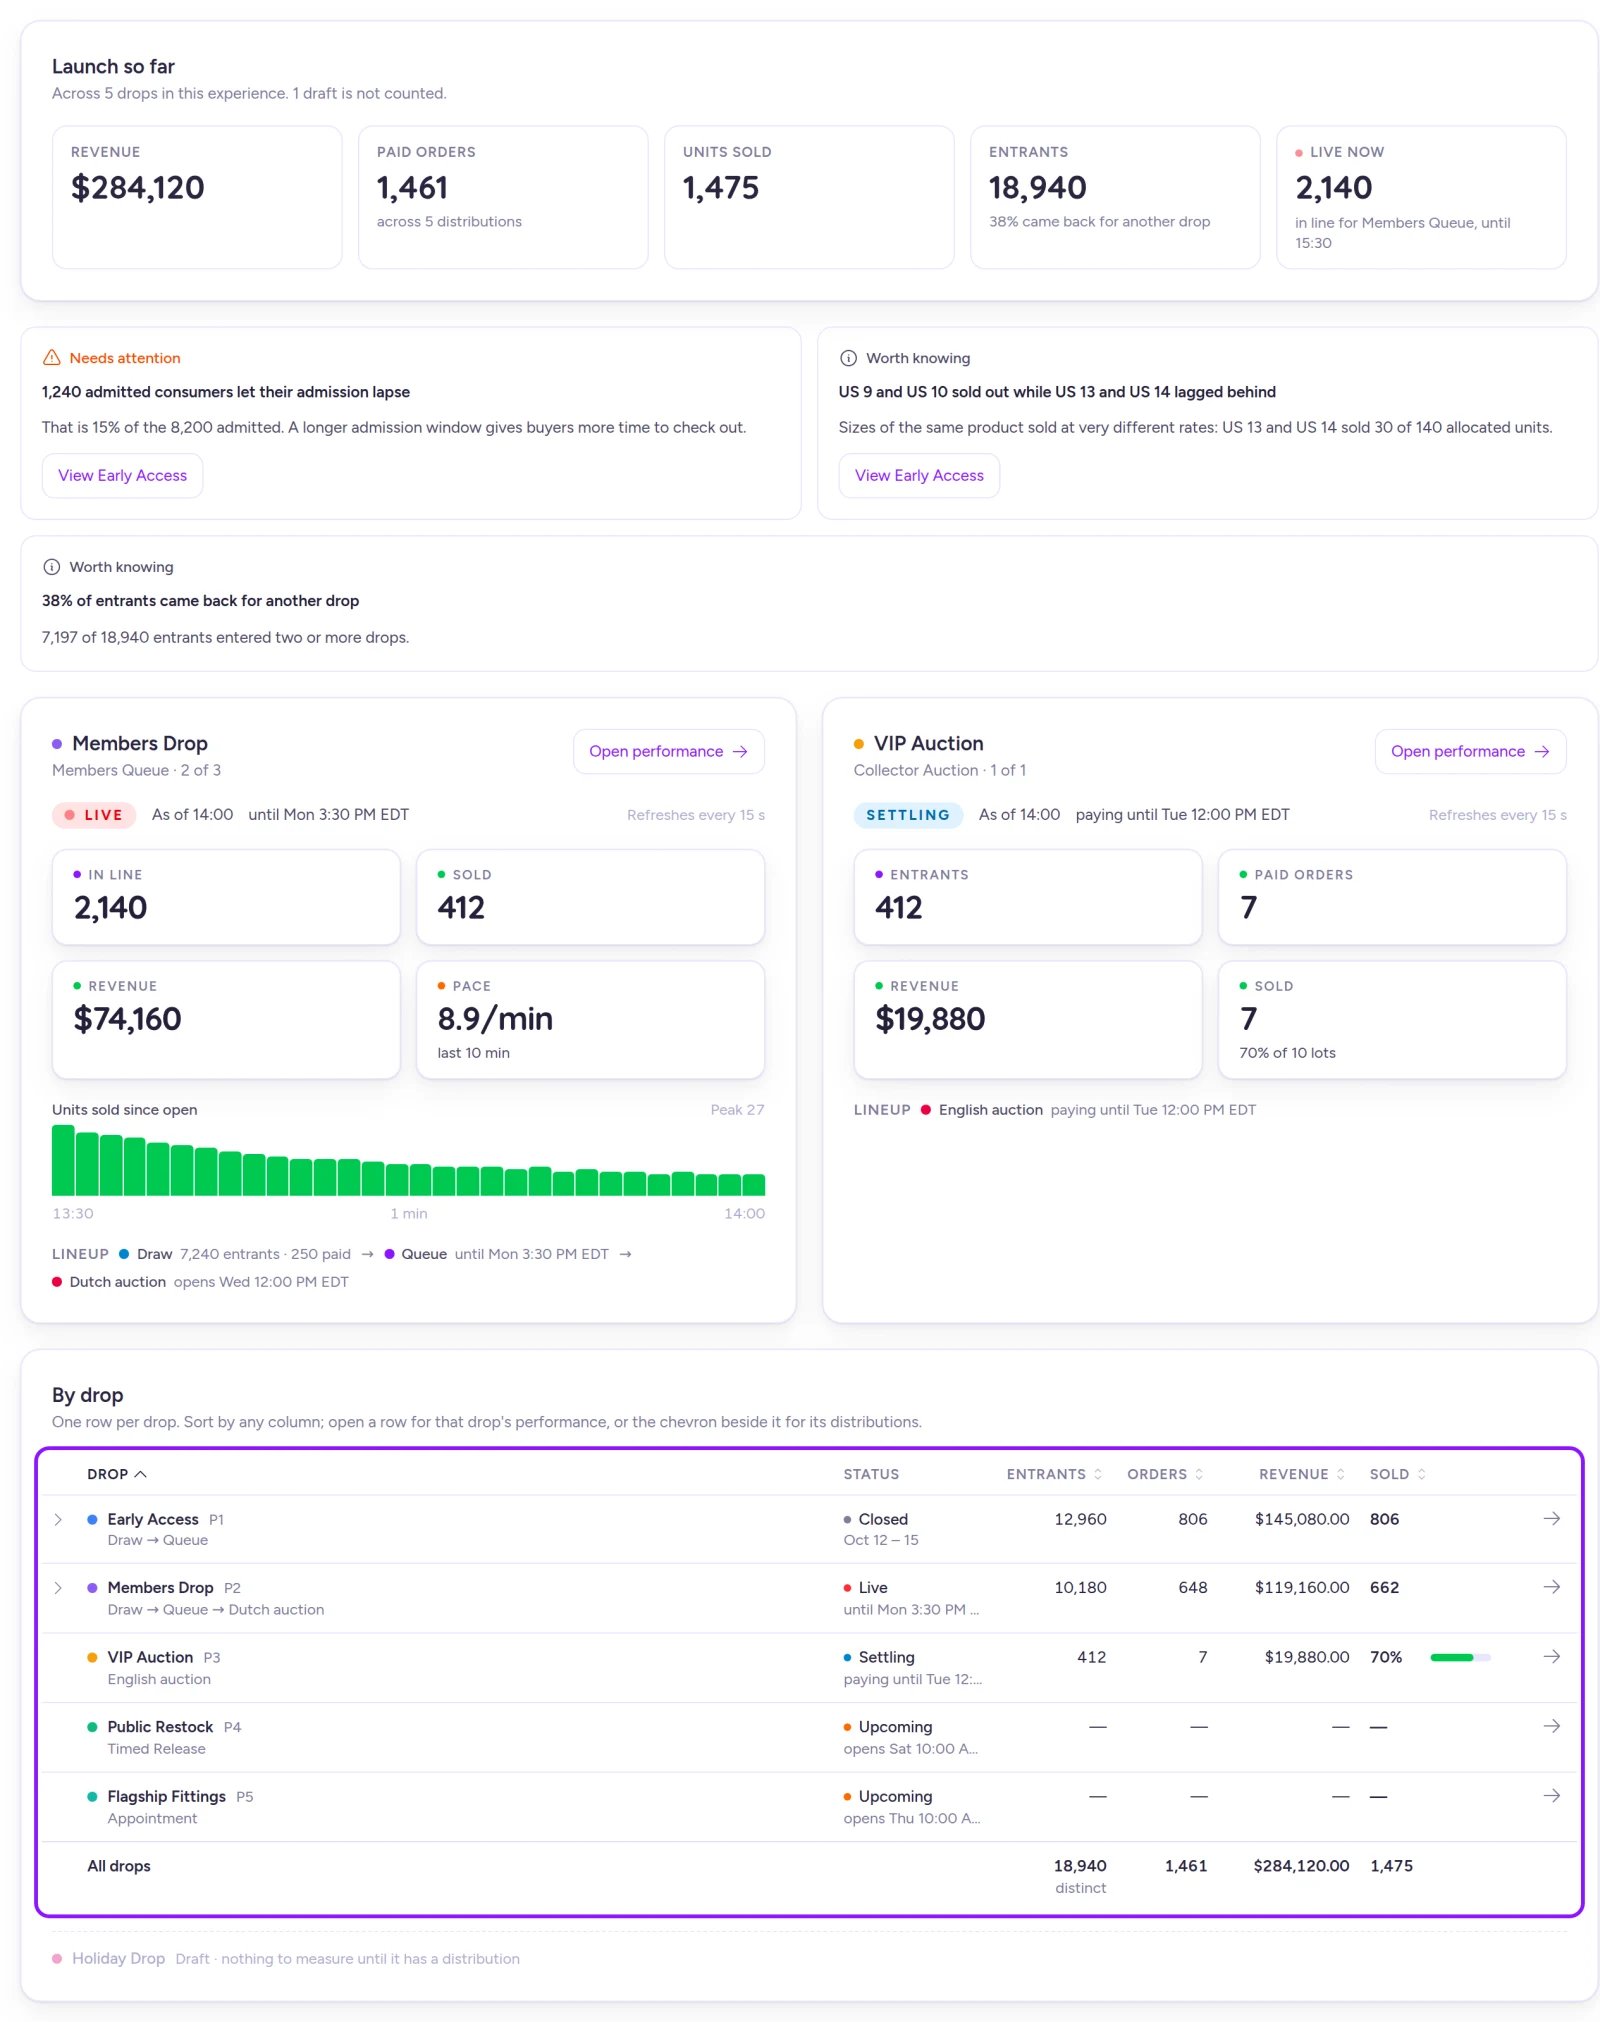
The experience overview totals every drop in the experience; select any row in By drop to inspect that sequence.
Insights
Once sequences close, Fanfare surfaces automated findings labeled Needs attention or Worth knowing to help you spot friction or inventory imbalances:
Insights never appear while a distribution is Settling. You’ll see them in two places:
- Closed queue results on the sequence Performance tab, with a View drop link to the sequence’s Overview.
- Experience overview (up to four insights at a time) for sequences that have completely closed. If a sequence still has an upcoming distribution, it’s excluded until all of its distributions finish.
By drop
The By drop table lists one row per sequence. Select any row to open that sequence’s Performance tab.
Rows sort by priority (creation order, which can’t be changed in the admin; see Sequences and routing). Select Entrants, Orders, Revenue, or Sold to sort highest first, or Drop to return to priority order; select a column header again to reverse it.
Sequences with multiple distributions expand via the chevron to link to each distribution’s results. If any paid orders in a sequence can’t be matched to a specific distribution, they still count in the sequence row and appear under “Not linked to a distribution” when you expand a multi-distribution sequence.
In the All drops footer, Entrants is deduplicated across sequences—each customer counts once, so the total is usually lower than the sum of individual rows.
Read a sequence’s Performance tab
When a sequence has a single distribution, its Performance tab opens directly to that distribution. With two or more distributions, a switcher at the top lets you toggle between Whole sequence and each individual distribution in time order (switching to a Distribution dropdown on narrow screens or with five or more distributions). By default, the tab opens on the most recently opened Live distribution—falling back to Settling, then the next Upcoming, then the most recently Closed.Whole sequence
Whole sequence displays Across the sequence summary tiles (Net revenue, Paid orders, Units sold, Entrants) above a By distribution breakdown table.Entrants in Whole sequence counts a customer once per distribution they entered (“Counted in each distribution”). Because the experience overview deduplicates across sequences, the same group of shoppers can produce a higher number here.
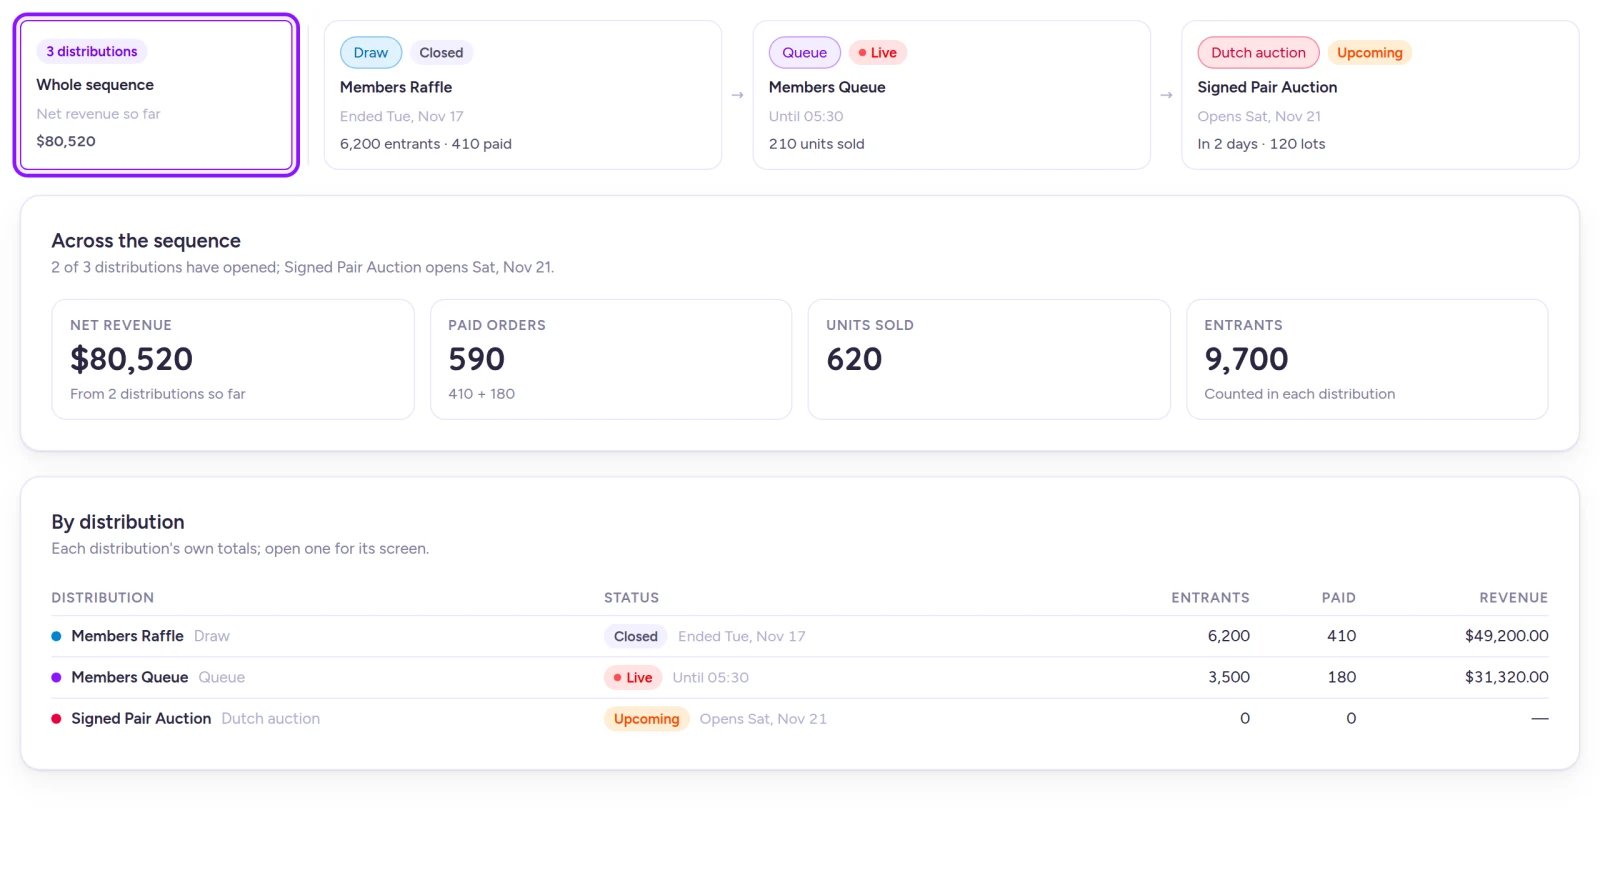
Whole sequence combines totals across every distribution in a single sequence.
Before a distribution opens
Before launch, the Before opening view shows an Opens in countdown along with a demand forecast:- Expected entrants — The median entrant count from up to five of this experience’s most recently closed distributions of the same type.
- Range — The lowest and highest entrant counts across those prior distributions.
Results when settling or closed
Once entry closes, the distribution view shows the sections below (omitting any section with no data):- Settling notice — While Settling, a banner notes that admitted shoppers can still complete payment and numbers may continue to change.
- Results — Entrants, Admitted, Paid orders, Units sold, and Net revenue (with gross revenue underneath). If an earlier distribution of the same type in this experience closed before this one opened, Entrants, Admitted, and Paid orders compare against it—and Units sold does too on multi-distribution sequences (otherwise Units sold shows allocated units).
- Insights — Automated findings on closed queues (see Insights).
- Entry to payment — Funnel showing entered, admitted, and paid counts with step-to-step conversion rates.
- Activity since open — Time-series chart of entries, admissions, and paid orders.
- Sizes — Units sold per size and sellout times. When a sequence has a single distribution, Allocated is populated alongside a size sellout chart; multi-distribution sequences show ”—” for Allocated because stock is allocated per sequence, not per distribution (see Stock).
- How queue places ended — Breakdown of queue outcomes: Admission lapsed, Still waiting at close, Left the queue, Turned away, sold out, and Other.
- Changes after opening — Any settings adjusted while the distribution was live.
- Announcements — Email and SMS delivery, open, and click counts.
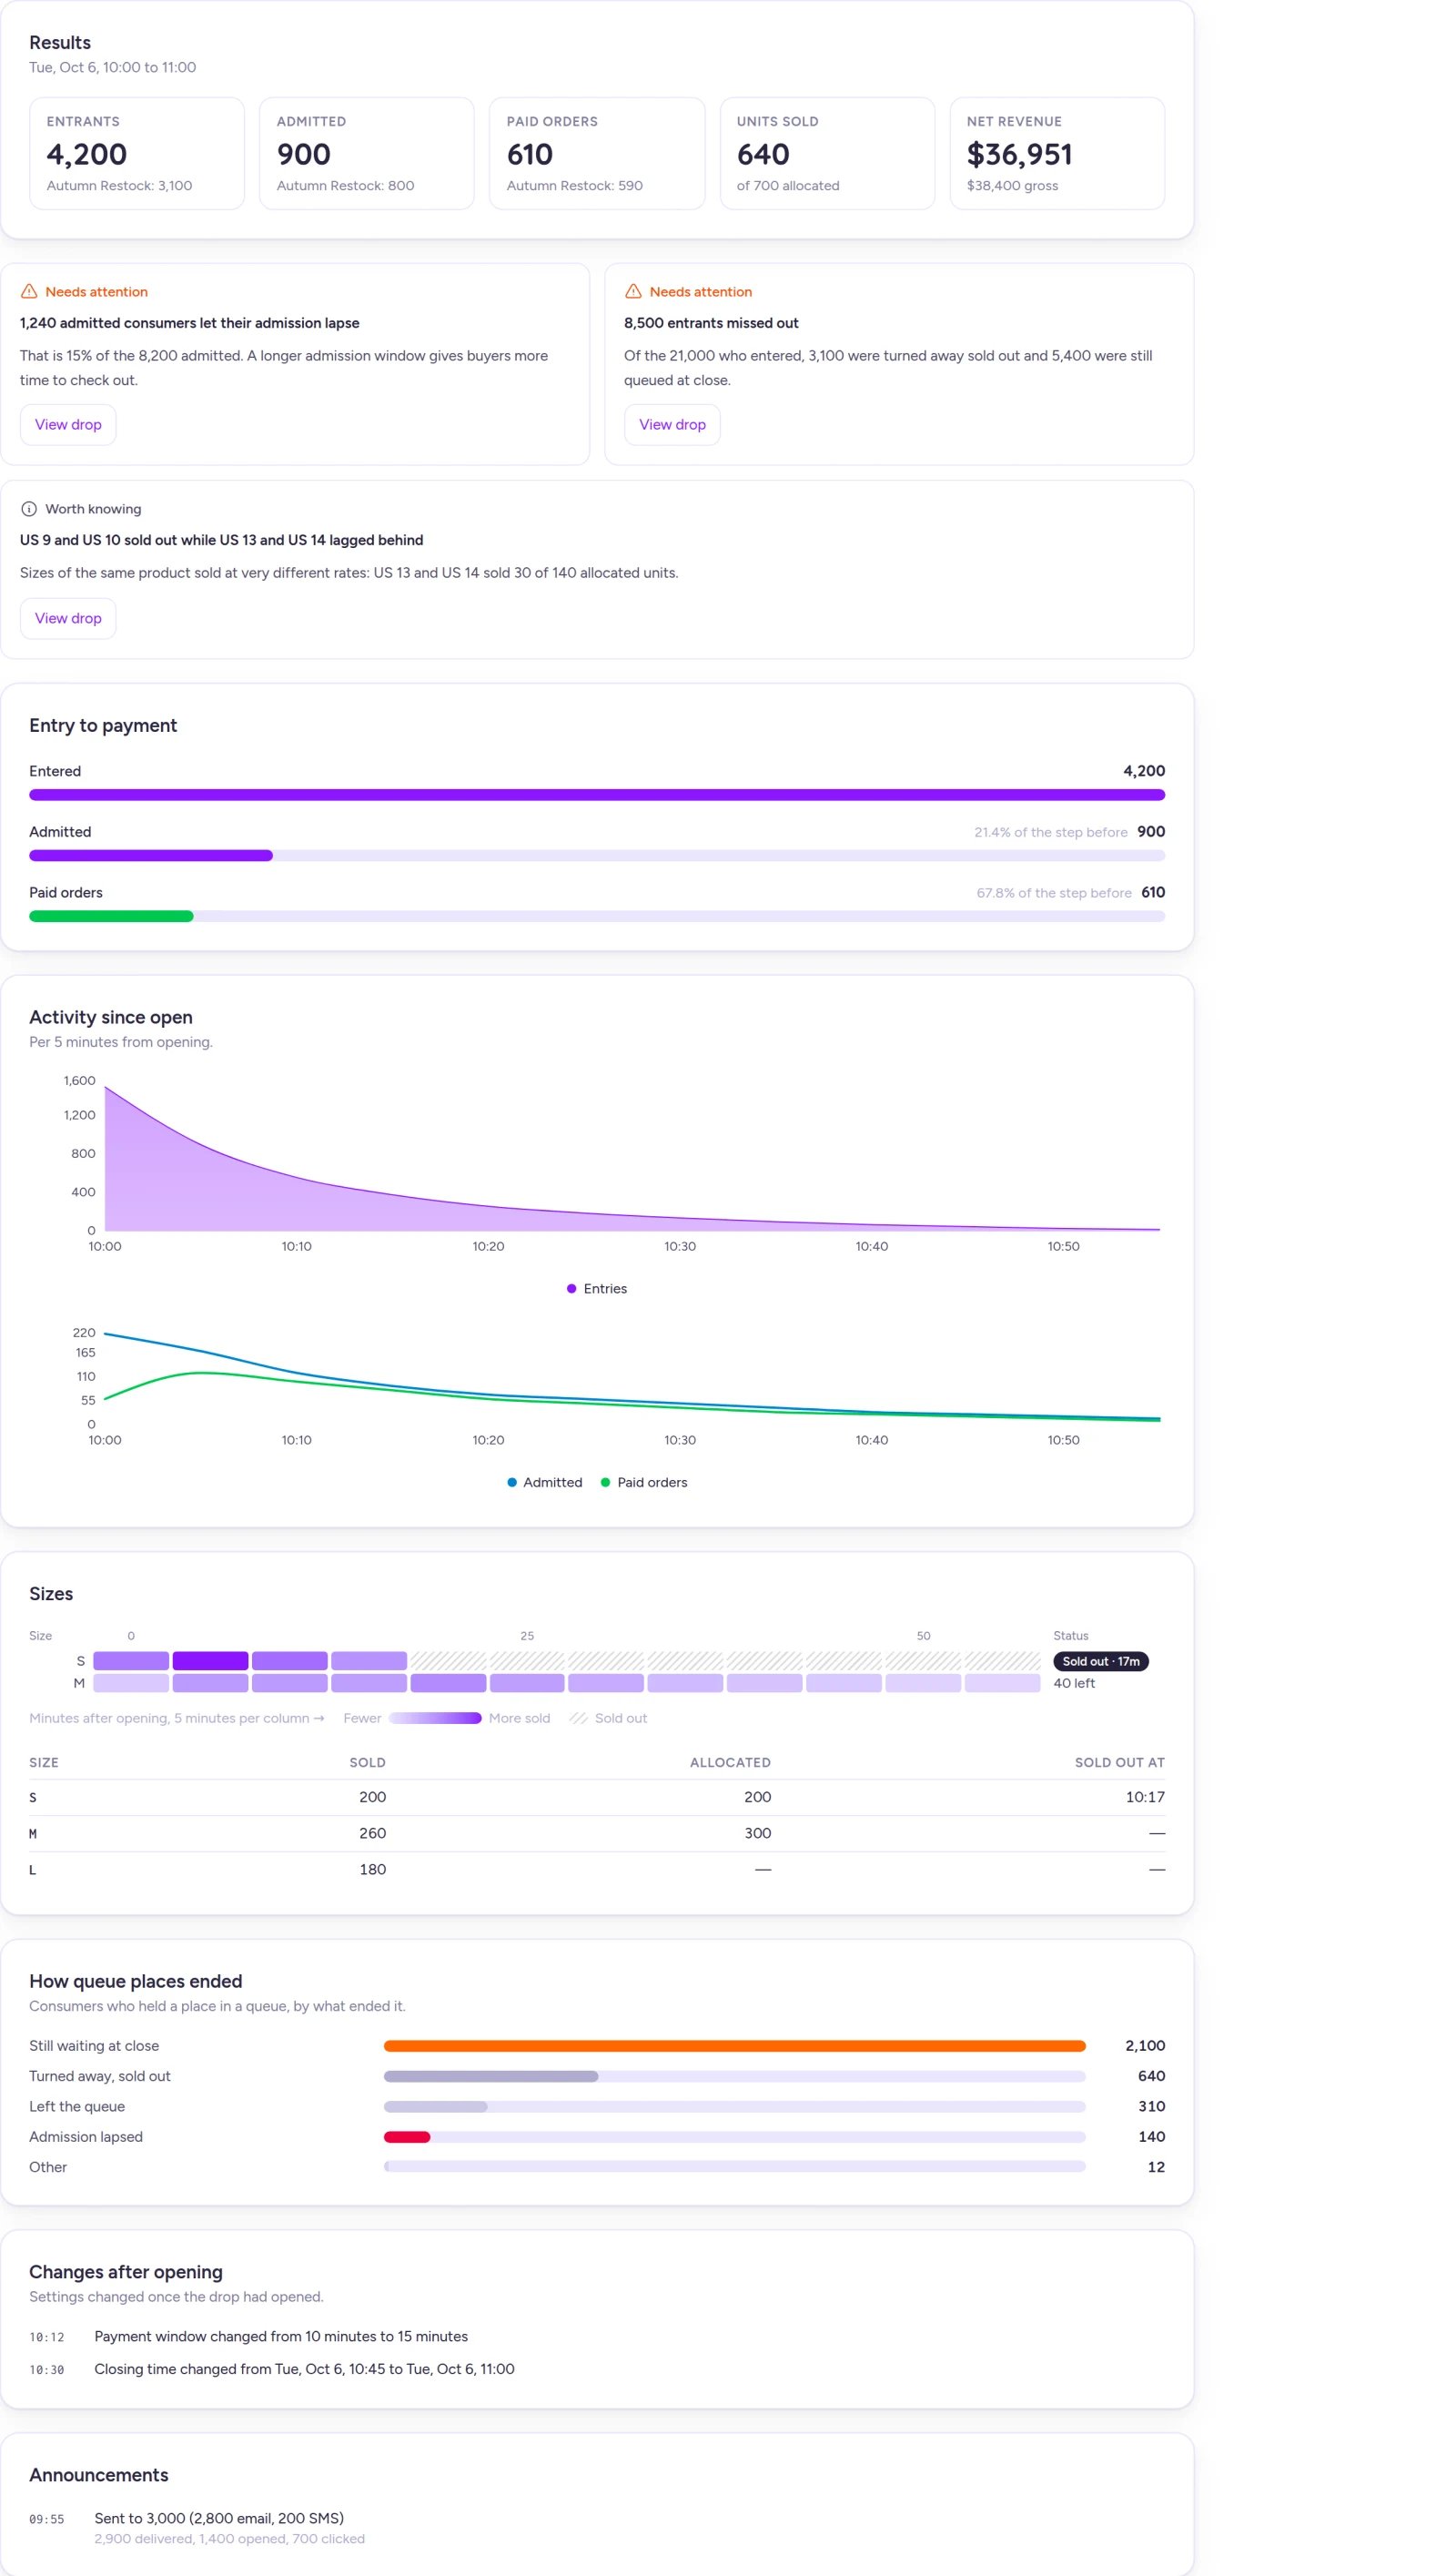
Closed queue results pair headline metrics and comparisons with funnel conversion, size sellout timing, and queue outcomes.
The Performance card on a sequence page
Every tab inside a sequence includes a compact Performance card tracking Entries, Denials, distribution-specific wins (Queue grants, Draw winners with Lapsed winners, Auction winners), Paid orders, Conversion, and Revenue.This card uses the time period you last selected on Home in the same browser—changing the period on Home updates every sequence’s card. It doesn’t auto-refresh; reload the page for the latest numbers. Orders that aren’t attributed to a specific drop are excluded from its totals.
Metric definitions
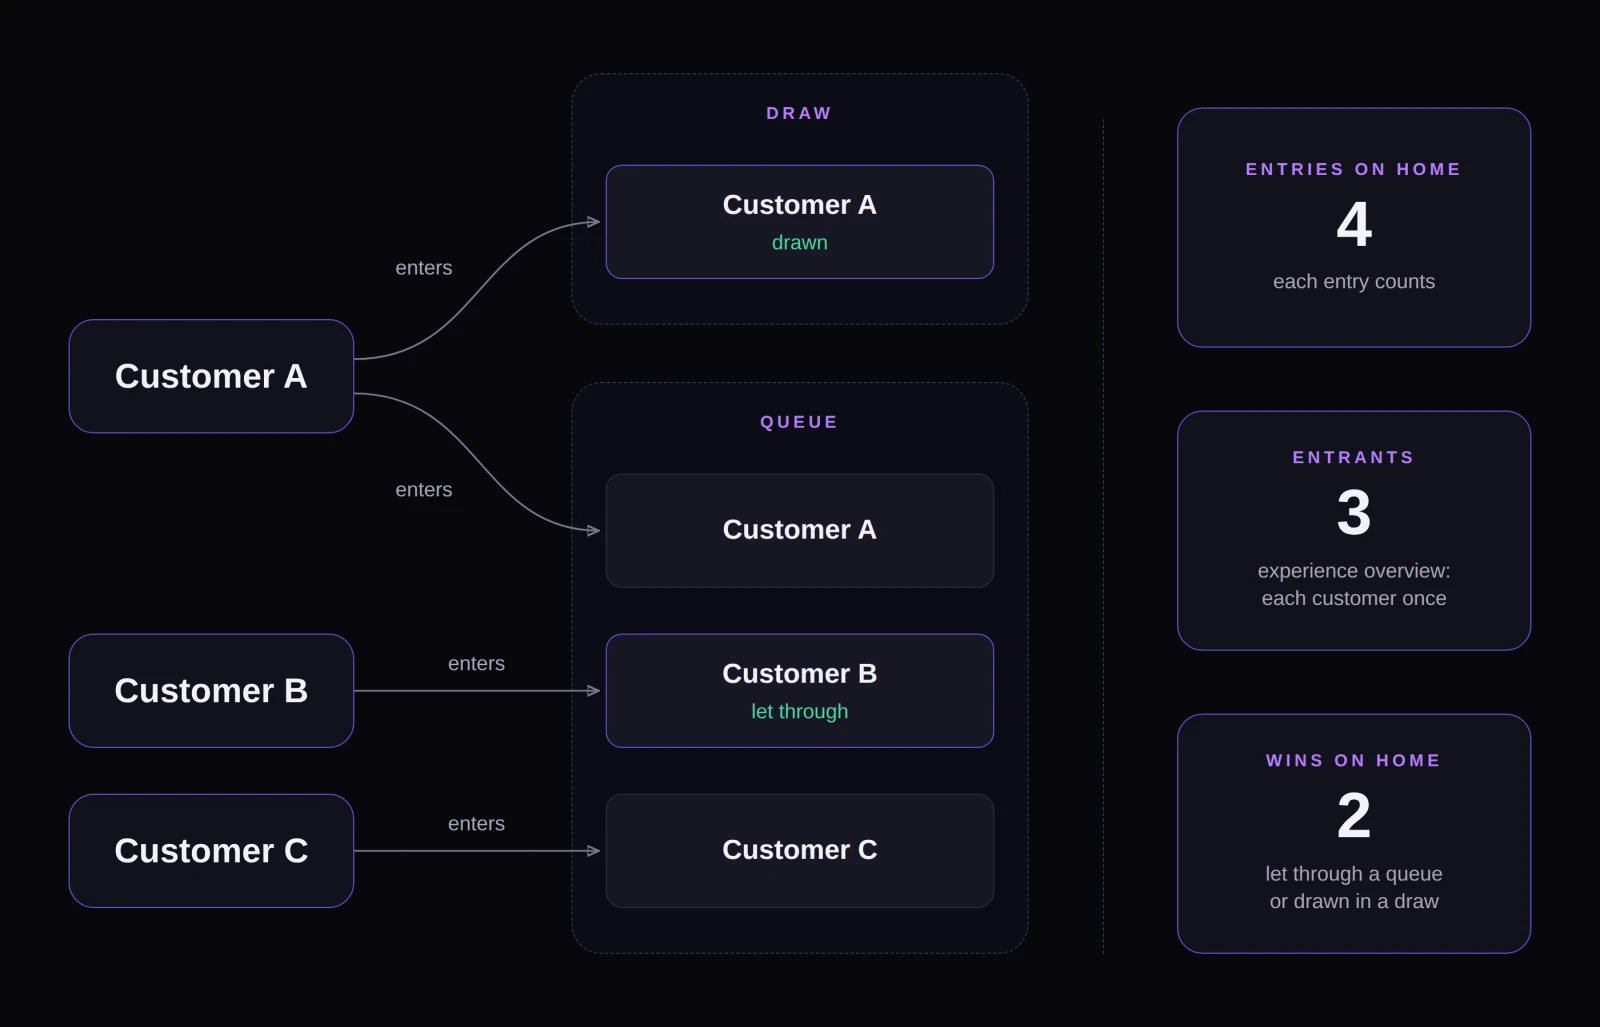
Three customers produce 4 Entries, 3 Entrants, and 2 Wins depending on whether actions, unique people, or admissions are counted.
If you delete a distribution, its individual screen disappears, but its paid orders remain in the sequence totals under “Not linked to a distribution”.
Data freshness, time zones, and currencies
- Refresh intervals: Settling results update roughly every 30 seconds; closed results refresh about every minute. Experience overview Entrants can lag up to 1 minute, overview Insights up to 5 minutes, and forecasts or prior-drop comparisons up to 1 hour. Updates pause while the browser tab is hidden.
- Time zones and rounding: Performance tabs use the experience’s time zone, while the Home chart uses your browser’s local time zone. Currency tiles round to whole units.
- Multiple currencies: Fanfare never converts or combines revenue across currencies. If an experience spans multiple currencies, Revenue / Net revenue displays ”—” on the experience overview and Whole sequence, the Net revenue tile is hidden on distribution results, and Home displays the largest currency with “+N more”.
On Shopify
Home and both Performance tabs work the same inside the Fanfare Shopify app. Until checkout protection is on and the product widget is on your theme, Home displays a Finish setting up Fanfare card above the metrics panel—see Storefront setup.Refunds and cancellations processed in Shopify don’t sync back to Fanfare, so Paid orders and Net revenue continue counting those orders in full. See Orders with Shopify checkout.
Troubleshooting
Home metrics stopped refreshing automatically
Home metrics stopped refreshing automatically
Auto-refresh turns itself off after a network or loading error. Select Auto-refresh Off to turn it back on, or select Refresh to reload immediately.
The experience Performance tab says 'Unable to load performance data for this experience.'
The experience Performance tab says 'Unable to load performance data for this experience.'
If you see “Unable to load performance data for this experience.”, select Try again to reload the overview. If the error persists, refresh the page to check whether the experience was deleted.
Related
Watch a live drop
Monitor queues, admissions, and sales in real time while a drop is running.
Orders and refunds
Search orders, issue refunds, and decide whether items return to stock.
Customer profiles
Inspect an individual customer’s spend, invites, and drop history.
Set up the next drop from this one
Turn drop results into audiences, loyalty rewards, and settings for your next launch.